vpsAdmin and status.vpsf.cz provide metrics for the Prometheus monitoring system. I've already written about the original proposal, but the final metrics differ slightly, so check the current state in vpsAdmin instead.
Metrics
First, create a new access token in vpsAdmin under Edit profile → Metrics access tokens. vpsAdmin shows a scrape URL to add to your Prometheus configuration, just like the node_exporter you probably already have there. You can also open the URL in a browser or terminal to see the available metrics.
These include CPU, memory and disk usage, load average, data transfers, OOM killer counts, and even the date your membership is paid through. Individual node statuses and outages or maintenance are included too. vpsAdmin updates VPS statuses every two minutes, so there's little point scraping more frequently.
Prometheus lets you track values over time, create your own rules and send alerts through alertmanager. We chose the Prometheus export format mainly because we use it to monitor our infrastructure. I don't have experience with other systems, but apparently it works with Zabbix too.
Metrics are also available on https://status.vpsf.cz, linked in the footer.
Heatmaps
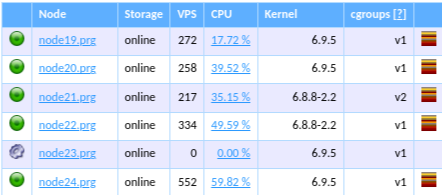
You can see individual nodes' load in real time on the vpsAdmin homepage. In the node list, click the heatmap icon on the right:
A window opens showing current CPU and disk load:
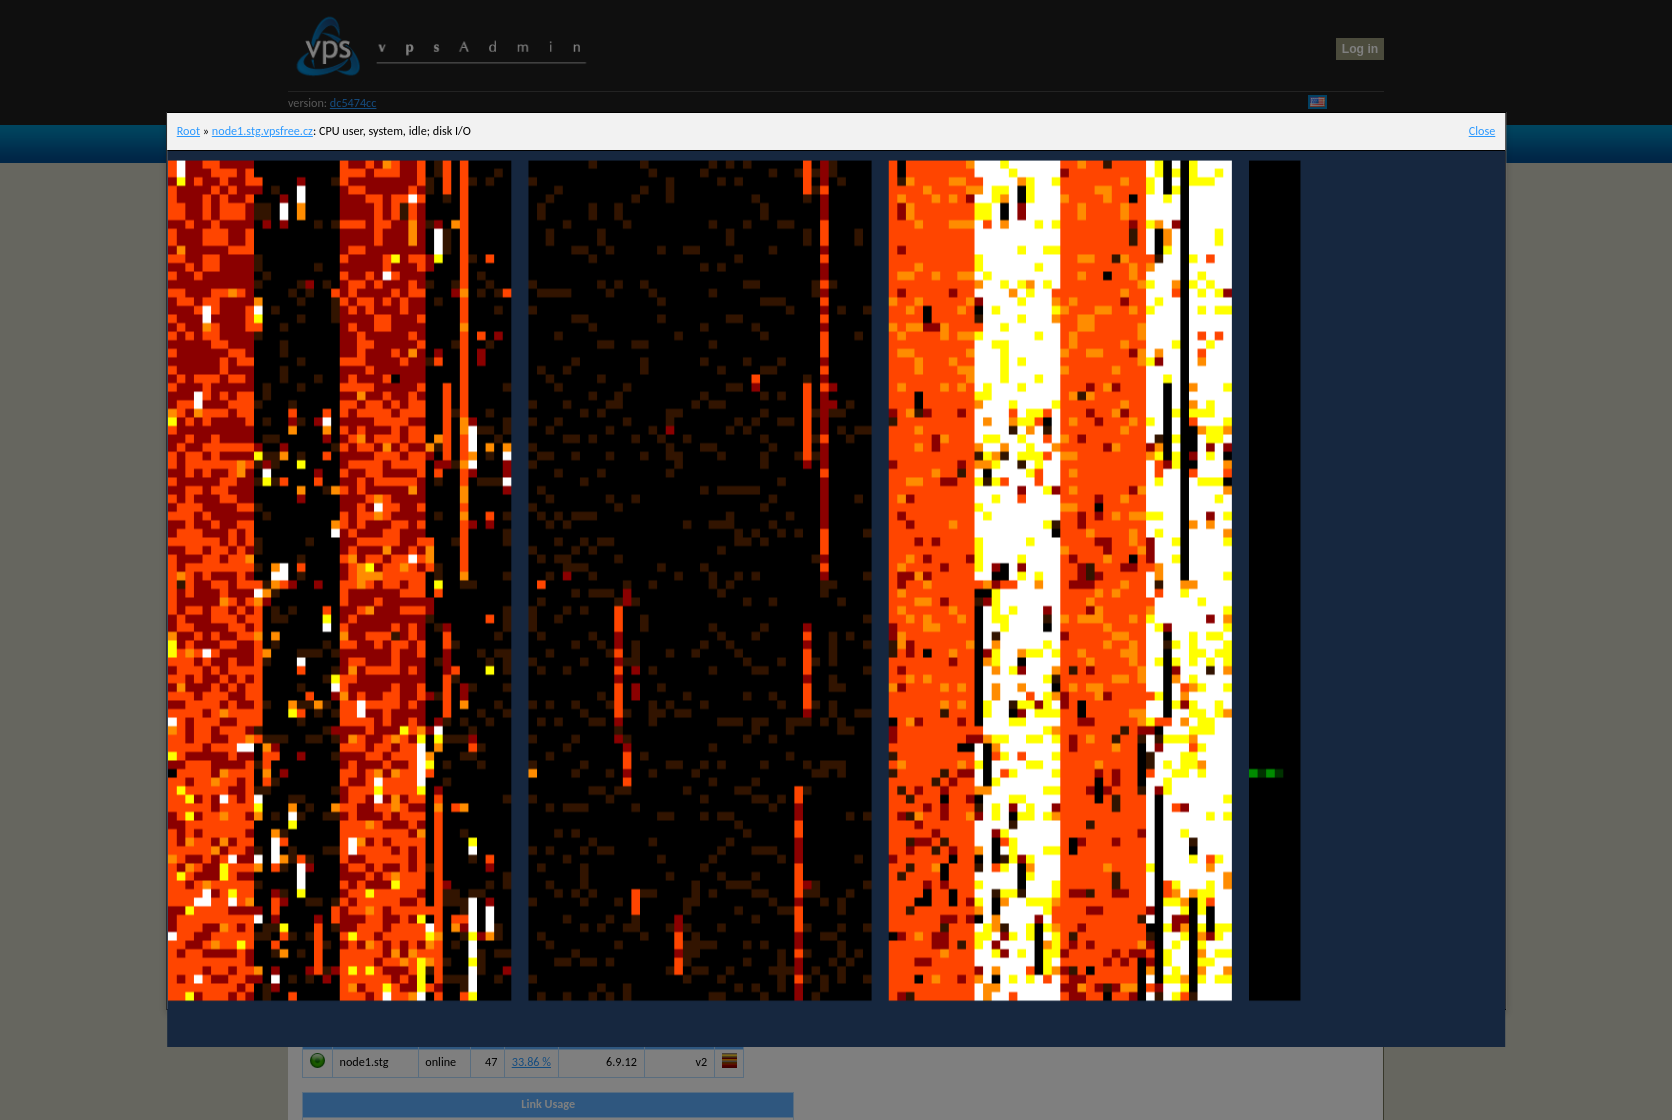
From the left, columns show user, system and idle for each CPU, followed by disk I/O. Each row represents one moment for all CPUs and disks. Colours range from black (0% load) to white (100% load). White in user/system columns means full usage; in an idle column, it means that CPU is free. Close the window with Close at the top right or by clicking anywhere outside it.
Rendering the heatmap in a browser takes considerable CPU power. The application tries to detect this and gradually adjusts its size for smooth rendering, shortening the history. On larger nodes with 128/256 CPUs, you may therefore see only a ~200px-high strip, like I do. It just won't run faster 
Click the heatmap to pause rendering and show labels for individual CPUs and disks at the top. Click again to resume. The node-name link in the window title opens the heatmap full-screen.
If your VPS's performance seems off, you can quickly see what's happening on its node right now. If you notice increased load every 15s, for example, that's a ZFS transaction group (txg) syncing to disk.
If you're interested, the source code is on GitHub. It's a Go application that starts a web server on port 8080 by default, showing a heatmap for that system.